Debugging
Debugger
Graphiti comes with a debugger that shows the queries executed for a
given request. Remember that Resources have a query interface independent of a request or response. And Resources connect similar to ActiveRecord’s includes:
employees = EmployeeResource.all
PositionResource.all(filter: { employee_id: employees.map(&:id) })
Remember, this is all customizable.
That means we can log the requests made by individual Resources:
/api/v1/employees?include=notes,positions.department.teams
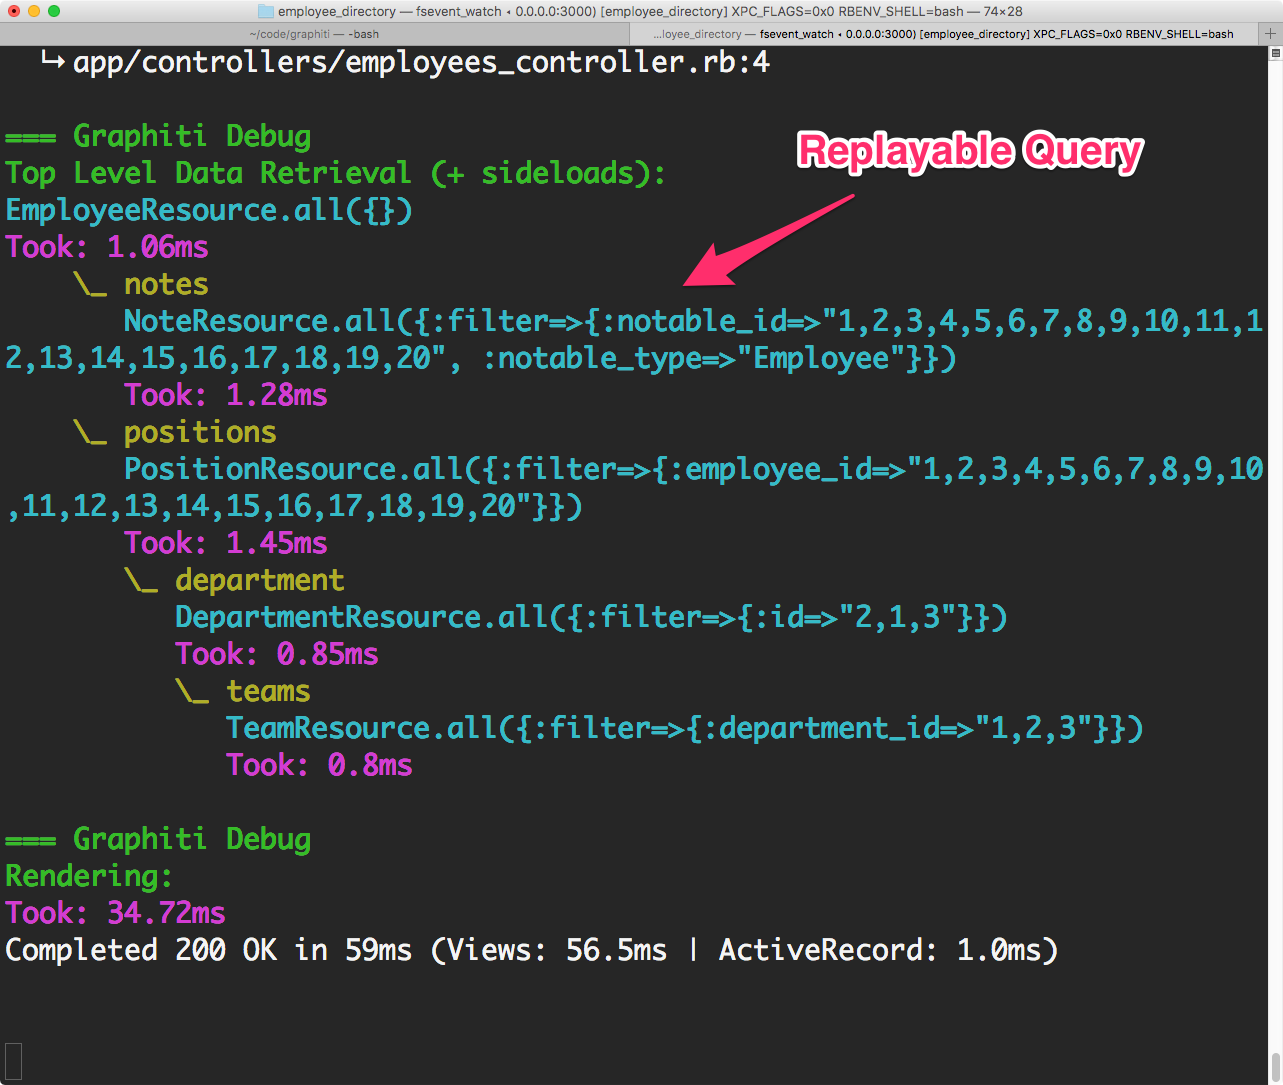
And even copy/paste these queries into a console session to debug:
$ bin/rails c
>> TeamResource.all({:filter=>{:department_id=>"1,2,3"}})
If you’re having trouble with a request, see if you can isolate to a specific Resource, then test that Resource directly.
Finally: if an error occurs, we’ll note the query that caused it:

JSON Output
It can be helpful to have this debug output come back as part of the JSON response. To enable this:
# app/controllers/application_controller.rb
def allow_graphiti_debug_json?
  true
  # or, current_user.admin?
  # or, Rails.env.development?
end
And request the debug output:
/your/url?debug=true
You should now see the debug output in meta:

If there’s an error, and you’ve enabled raw errors, you’ll also see the query that caused the error in the JSON response:

1.2 Configuration
By default, we’ll log to Rails.logger, and only enable debugging (logs
or JSON) when Rails.logger.level is set to debug. Here are the
various ways to configure.
Use config.debug to explicitly toggle debugging:
# config/initializers/graphiti.rb
Graphiti.configure do |c|
  c.debug = false
end

# Or use environment variable
# GRAPHITI_DEBUG=false
Use config.debug_models to get additional (but verbose) output:

# config/initializers/graphiti.rb
Graphiti.configure do |c|
  c.debug_models = true
end

# Or use environment variable
# GRAPHITI_DEBUG_MODELS=true
As noted above, allow_graphiti_debug_json? must return true if you
want JSON output:
# app/controllers/application_controller.rb
def allow_graphiti_debug_json?
  true
  # or, current_user.admin?
  # or, Rails.env.development?
end
Note you need to explicitly pass ?debug=true in the request.
Assign a different logger:
Graphiti.logger = Logger.new(...)

# Or the built-in STDOUT logger:
Graphiti.logger = Graphiti.stdout_logger
Manually apply the debugging (when using Rails, this normally happens in
a around_action):
Graphiti::Debugger.debug do
  EmployeeResource.all
end
2 Rake Tasks
There are some common debugging scenarios that are possible to do manually, but their frequency warrants common patterns. For these, we have rake tasks.
2.1 graphiti:request
bin/rake graphiti:request[PATH,DEBUG]
Execute a request using ActionDispatch::Integration::Session (which
underlies request specs).
This can be helpful when you don’t have, or don’t want to spin up, a web server. Imagine you want to debug something on production, so you shell into a docker container and edit some files locally. Now you want to execute a request and see if your changes worked:
$ bin/rake graphiti:request[/employees]Will execute the request and spit out the JSON response. You may want to run with the Debugger enabled:
$ bin/rake graphiti:request[/employees,true]Which add Debugger output as well.
The PATH should not contain the domain unless you want to hit a live
API instead of a test server.
2.2 graphiti:benchmark
bin/rake graphiti:benchmark[PATH,NUM_REQUESTS]
It can be helpful to run a quick benchmark without hitting a live web server, to eliminate the vagaries of latency. To do this:
$ bin/rake graphiti:benchmark[/employees,100]Which will return the average response time.
2.3 Authorization headers
If you have an Authorization scheme implemented (for example authenticate_or_request_with_http_token in rails) you can supply the Authorization http header value with the AUTHORIZATION_HEADER environment variable:
$ export AUTHORIZATION_HEADER="Token --PRIVATE_API_KEY--"
$ bin/rake graphiti:request[/employees,true]
This also will work for Basic (request_http_basic_authentication) and Bearer values
3 Tips
When debugging an application, try to isolate the individual Resource call and debug the Resource directly (instead of running the entire request). This helps eliminate variables, and plain ruby code is easier to work with. If possible, try to remove Graphiti entirely and focus on your Models and Backends.
The most common scenario is debugging a query. We suggest overriding
resolve and using pry (or equivalent):
# Introspect the scope without firing a query
# Call 'super' to fire the query
def resolve(scope)
  binding.pry
end